Introduction
AI automation represents one of the most significant technological shifts in modern business history, with Harvard Business Review research showing fundamental transformations in how organizations operate and compete. Understanding AI automation ROI has become critical for business leaders as they navigate investment decisions in this rapidly evolving landscape. Unlike previous automation waves that primarily replaced manual labor, AI automation augments human intelligence while automating complex cognitive tasks, creating unprecedented opportunities for business transformation and measurable returns on investment.
Quantified Impact Data:
- Productivity Gains: 25-45% average improvement in automated processes within the first year
- Cost Reduction: 20-60% direct savings for suitable AI automation processes
- Revenue Enhancement: 10-25% average increase through improved customer experience
- Market Valuation: AI-forward companies trade at 15-35% higher multiples than traditional competitors, according to McKinsey Global Institute analysis.
This guide is part of our comprehensive AI automation series – explore our complete resource library at the bottom of this page.
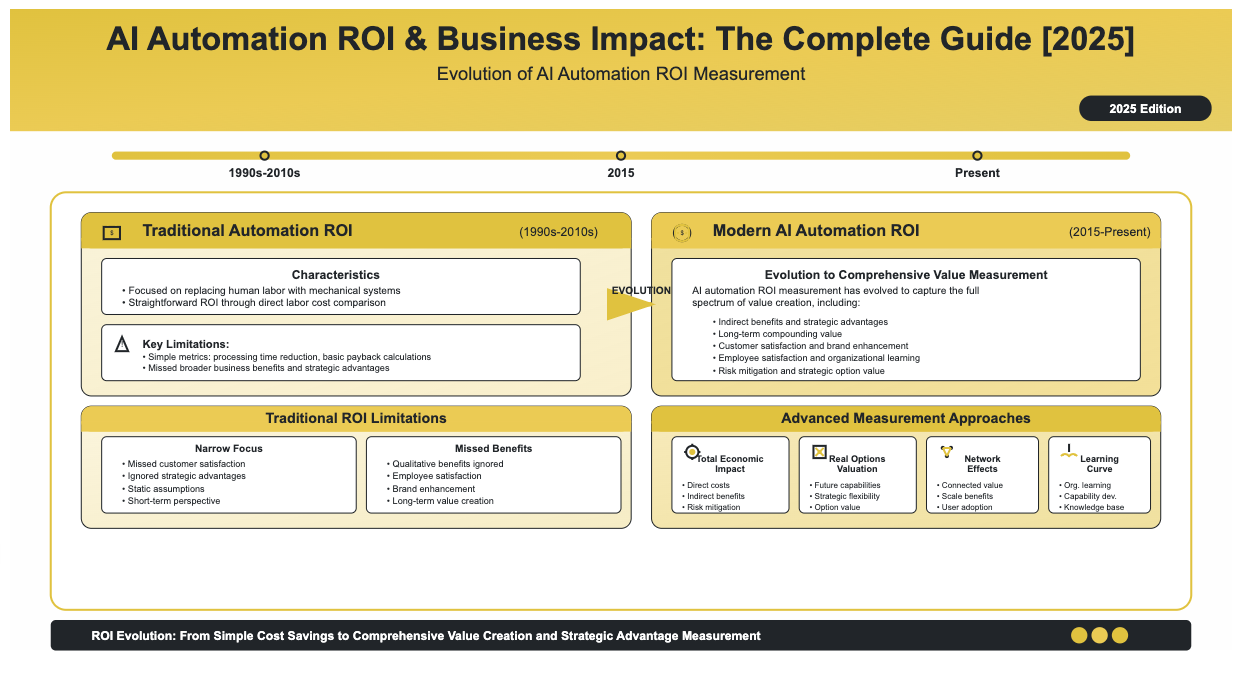
Evolution of AI Automation ROI Measurement
Traditional Automation ROI (1990s-2010s)
Early automation focused on replacing human labor with mechanical systems, making ROI calculation straightforward through direct labor cost comparison. Traditional models used simple metrics like processing time reduction and basic payback calculations, but missed broader business benefits.
Limitations:
- Narrow value focus, missing customer satisfaction, and strategic advantages
- Static assumptions do not account for improving systems
- Ignored qualitative benefits like employee satisfaction and brand enhancement
- The short-term perspective focused on immediate payback rather than long-term value
Modern AI Automation ROI (2015-Present)
AI automation ROI measurement has evolved to capture the full spectrum of value creation, including indirect benefits, strategic advantages, and long-term compounding value.
Advanced Measurement Approaches:
- Total Economic Impact: Direct costs, indirect benefits, risk mitigation value, and strategic option value using methodologies like Forrester’s TEI framework.
- Real Options Valuation: Treating AI automation as creating valuable future business capabilities, following Black-Scholes option pricing models.
- Network Effects: Measuring value increases as more processes and users connect
- Learning Curve Benefits: Quantifying organizational learning and capability development
Stakeholder Perspectives on Automation Value
Executive Leadership Perspective
Strategic Value Focus: Competitive advantage, market expansion, innovation platform, risk management
ROI Expectations: 25-50% IRR over 3-5 years, quantifiable competitive positioning improvements, growth enablement, operational excellence
Operational Management Perspective
Efficiency Focus: Process efficiency, quality enhancement, cost reduction, reliability improvement
Key Metrics: Processing speed improvements, error rate reductions, resource utilization optimization, performance consistency
Financial Leadership Perspective
Performance Focus: ROI calculations, NPV analysis, cash flow impact, cost of capital comparison
Risk Considerations: Implementation risk, regulatory compliance, audit capabilities, financial reporting improvements
IT Leadership Perspective
Technology Focus: System integration, scalability, security enhancement, innovation platform development
Implementation Priorities: Technical debt avoidance, skill requirements, vendor management, performance monitoring
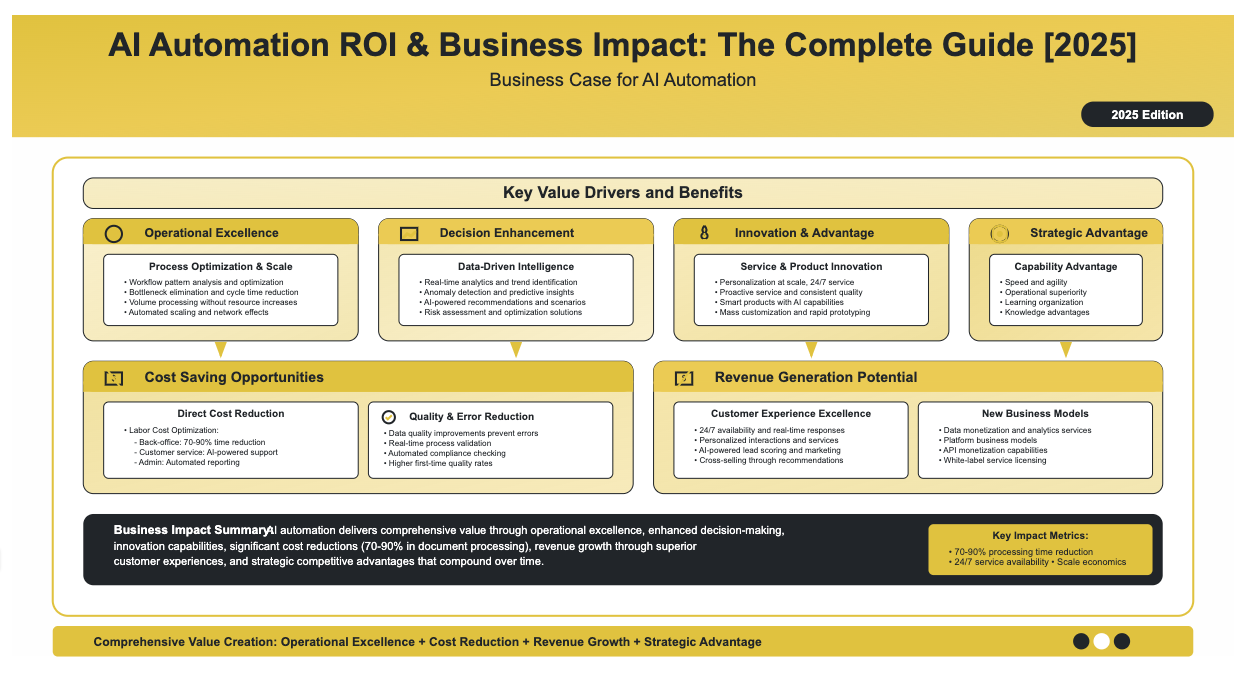
Business Case for AI Automation
Key Value Drivers and Benefits
Operational Excellence Enhancement
Process Optimization: AI systems analyze and optimize workflow patterns, eliminating bottlenecks and reducing cycle times while providing dynamic resource allocation and predictive maintenance.
Scale Economics Realization:
- Volume processing without proportional resource increases
- Consistency at scale across multiple locations and time zones
- Automated scaling based on demand
- Network effects create increasing value
Decision-Making Enhancement
Data-Driven Intelligence: Real-time analytics, trend identification, anomaly detection, and predictive insights enable better, faster decisions.
Decision Support Systems: AI-powered recommendations, scenario analysis, risk assessment, and optimization solutions for complex business problems.
Innovation and Competitive Advantage
Service Innovation:
- Personalization at scale for large customer bases
- 24/7 service delivery without human limitations
- Proactive service, anticipating customer needs
- Consistent service quality across all interactions
Product Innovation: Smart products with AI capabilities, mass customization, rapid prototyping, and market responsiveness.
Cost Saving Opportunities
Direct Cost Reduction
Labor Cost Optimization:
- Back-Office Operations: 70-90% reduction in document processing time, automated data entry, and validation
- Customer Service: AI-powered first-line support, intelligent routing, automated response generation
- Administrative Processes: Automated reporting, compliance monitoring, workflow orchestration
Operational Cost Reductions:
- Infrastructure: Server consolidation, cloud optimization, energy efficiency
- Supply Chain: Inventory optimization, supplier management, procurement automation, logistics optimization
Error Reduction and Quality Improvements
Quality Cost Savings:
- Data quality improvements prevent downstream errors
- Real-time process validation prevents errors before their occurrence
- Automated compliance checking prevents violations
- Higher first-time quality rates eliminate rework needs
Revenue Generation Potential
Direct Revenue Enhancement
Customer Experience Excellence:
- Response Time: 24/7 availability, real-time responses, proactive communication
- Personalization: Customized interactions, personalized engagement, value-added services
- Satisfaction Impact: Consistency, accuracy, and convenience improvements
Sales and Marketing Optimization:
- AI-powered lead scoring and personalized marketing
- Optimal timing of communications for maximum impact
- Cross-selling and upselling through intelligent recommendations
- Market expansion to new segments and geographies
New Business Model Creation
Platform and Ecosystem Value:
- Data monetization through analytics and insight services
- Platform business models create network effects
- API monetization provides AI capabilities to others
- White-label services licensing capabilities
Strategic Competitive Advantages
Capability-Based Advantages
Speed and Agility: Faster market response, adaptive operations, accelerated innovation cycles, rapid competitive response.
Operational Superiority: Lower cost structures, consistent quality delivery, rapid scalability, higher reliability.
Knowledge and Learning Advantages
Organizational Intelligence: Customer intelligence, market intelligence, operational intelligence, competitive intelligence.
Learning Organization: Continuous improvement systems, knowledge accumulation, best practice development, enhanced innovation capability.
Measuring AI Automation ROI
Traditional ROI Calculation Methods
Basic ROI Formula
ROI = (Net Benefit – Total Investment) / Total Investment × 100
Traditional Components:
- Total Investment: Implementation costs, ongoing expenses, and maintenance
- Net Benefit: Direct cost savings and revenue increases
- Time Period: Annual or project lifecycle (3-5 years)
Limitations for AI: Oversimplification, static analysis, missing indirect benefits, risk ignorance
Enhanced Financial Metrics
Net Present Value (NPV):
NPV = Σ[Cash Flowt / (1 + r)t] – Initial Investment, following standard financial analysis methodologies.
Payback Period Analysis: Discounted payback incorporates the time value of money, risk adjustment, and graduated benefits accounting.
AI-Specific Considerations
Learning and Improvement Effects
Adaptive Value Creation:
- Accuracy Improvements: AI models become more accurate with additional data
- Efficiency Gains: Systems optimize themselves and improve operational efficiency
- Scope Expansion: Capabilities expand beyond initial use cases
- Network Effects: Value increases as more processes connect
Implementation Complexity Factors
Non-Linear Patterns:
- Front-Loaded Investment: High initial costs, learning curve expenses, integration complexity
- Delayed Benefit Realization: Implementation time, adoption curves, process maturation
- Risk Management: Technology risks, market risks, organizational risks
Direct vs. Indirect Benefits
Direct Benefit Quantification
Measurable Improvements:
- Labor Cost Savings: FTE reduction, productivity gains, overtime reduction
- Process Efficiency: Cycle time reduction, throughput increases, error rate reduction
- Material Savings: Inventory optimization, energy efficiency, waste reduction
Calculation Framework:
Annual Labor Savings = (FTE Eliminated × Average Cost) + (Productivity Gain % × Affected FTE × Average Cost) + (Overtime Reduction × Hourly Rates)
Indirect Benefit Assessment
Strategic Value Creation:
- Market Position Enhancement: Brand value, customer loyalty, market differentiation
- Innovation Benefits: Learning organization, innovation platform, skill development
- Risk Mitigation Value: Operational risk reduction, compliance assurance, business continuity
Comprehensive ROI Framework
Multi-Dimensional ROI Model
Comprehensive ROI = (Financial ROI × 40-60%) + (Operational ROI × 25-35%) + (Strategic ROI × 15-25%)
Financial Dimension: Cost reduction ROI, revenue enhancement ROI, cash flow improvements, profit margin impact.
Operational Dimension: Process efficiency, resource productivity, capacity utilization, quality improvements.
Strategic Dimension: Innovation capability, learning rate, knowledge assets, and adaptability improvements.
Impact Across Business Functions
Operations and Process Efficiency
Manufacturing Operations
Quantified Results:
- Overall Equipment Effectiveness: 15-25% improvement through predictive maintenance
- First-Pass Yield: 20-40% quality improvement through automated control
- Inventory Turnover: 25-35% improvement through demand forecasting
- Production Cycle Time: 30-50% reduction through optimization
Service Operations
Customer Service Transformation:
- First Contact Resolution: Improvement from 65-75% to 85-95%
- Average Handle Time: 40-60% reduction in resolution time
- Customer Satisfaction: 25-40% improvement in satisfaction scores
- Agent Productivity: 50-70% increase in cases handled per agent
Customer Experience Enhancement
Personalization at Scale
Impact Results:
- Customer Engagement: 40-60% increase through personalized experiences
- Conversion Rates: 25-35% improvement through personalized recommendations
- Customer Lifetime Value: 20-30% increase through improved experience
- Revenue per Customer: 15-25% increase through personalization
Proactive Customer Service
Results:
- Problem Prevention: 60-80% reduction in reactive service issues
- Customer Retention: 15-25% improvement through proactive service
- Service Costs: 40-60% reduction through problem prevention
- Customer Advocacy: Significant increases in referrals and advocacy
Employee Productivity and Satisfaction
Workforce Transformation
Productivity Enhancement:
- Time Savings: 2-4 hours per day through task automation
- Focus Time: 40-60% increase in high-value activities
- Output Quality: 25-35% improvement through AI assistance
- Innovation Time: 50-100% increase in innovation activities
Career Development Impact:
- Job Satisfaction: 30-50% improvement through routine work elimination
- Employee Retention: 20-30% improvement in AI-augmented roles
- Stress Reduction: 25-40% reduction in work-related stress
- Professional Growth: Enhanced development opportunities
Industry-Specific Impact Analysis
Financial Services
Digital Banking Results:
- Customer Satisfaction: 35-50% improvement through personalized service
- Product Adoption: 40-60% increase through targeted recommendations
- Customer Lifetime Value: 25-40% increase through engagement
Risk and Compliance:
- False Positive Reduction: 60-80% in fraud/AML alerts
- Compliance Costs: 40-60% reduction in operational costs
- Risk Detection Speed: 90 %+ improvement in identification speed
Healthcare
Clinical Operations:
- Diagnostic Accuracy: 15-25% improvement through AI assistance
- Treatment Outcomes: 20-30% improvement through optimization
- Readmission Reduction: 25-40% through predictive monitoring
Administrative Efficiency:
- Claims Processing: 70-85% reduction in processing time
- Coding Accuracy: 90-95% accuracy in automated coding
- Revenue Cycle: 40-60% improvement in efficiency
Manufacturing
Smart Manufacturing:
- Equipment Effectiveness: 15-25% improvement
- Quality Improvements: 40-60% reduction in defect rates
- Energy Efficiency: 20-30% reduction in consumption
- Safety Incidents: 50-70% reduction in workplace incidents
Retail and E-commerce
Customer Experience:
- Conversion Rates: 25-40% improvement through personalization
- Average Order Value: 20-35% increase through recommendations
- Customer Retention: 30-45% improvement through loyalty programs
Operations:
- Fulfillment Speed: 50-70% improvement in order fulfillment
- Warehouse Efficiency: 60-80% productivity improvement
- Fraud Reduction: 70-85% reduction in fraudulent transactions
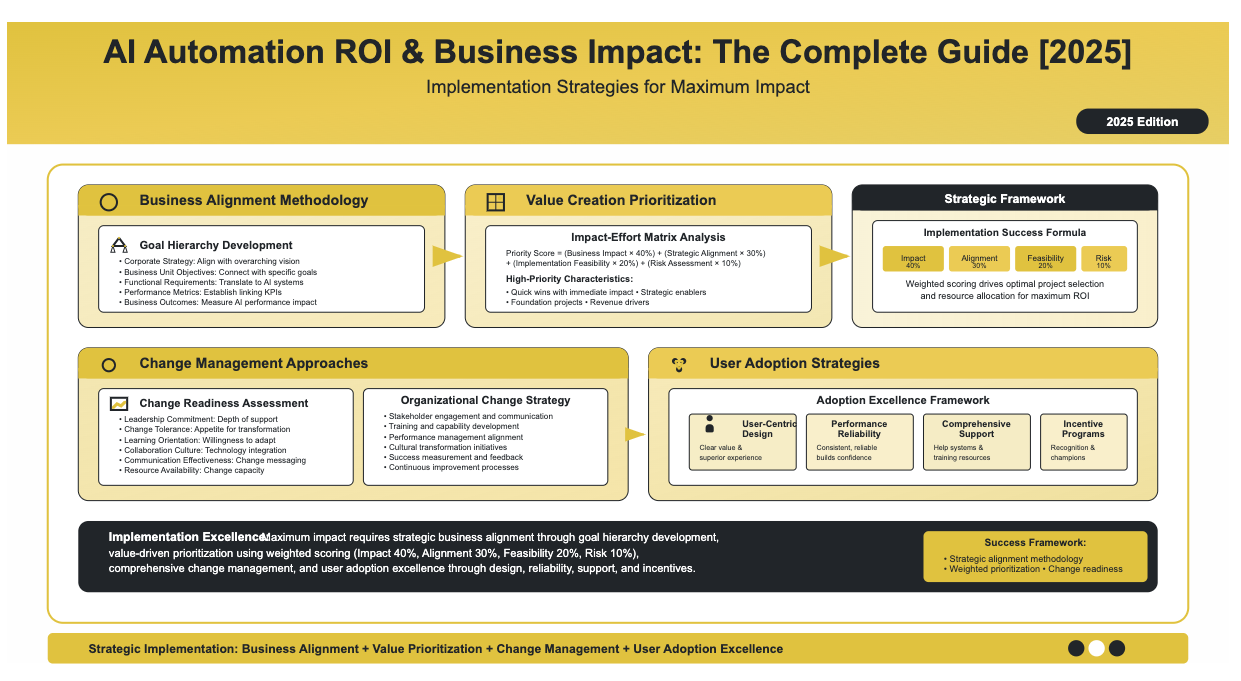
Implementation Strategies for Maximum Impact
Business Alignment Methodology
Strategic Alignment Framework
Goal Hierarchy Development:
- Corporate Strategy: Align with overarching strategy and vision
- Business Unit Objectives: Connect with specific unit goals
- Functional Requirements: Translate to specific AI system requirements
- Performance Metrics: Establish KPIs linking AI performance to business outcomes
Value Creation Prioritization
Impact-Effort Matrix Analysis:
Priority Score = (Business Impact × 40%) + (Strategic Alignment × 30%) + (Implementation Feasibility × 20%) + (Risk Assessment × 10%)
High-Priority Characteristics: Quick wins, strategic enablers, foundation projects, revenue drivers.
Change Management Approaches
Organizational Change Strategy
Change Readiness Assessment:
- Leadership Commitment: Depth of leadership support
- Change Tolerance: Organizational appetite for transformation
- Learning Orientation: Willingness to adapt and learn
- Collaboration Culture: Ability to work with technology systems
User Adoption Strategies
Adoption Excellence Framework:
- User-Centric Design: Focus on clear value and superior experiences
- Performance Reliability: Consistent, reliable performance builds confidence
- Comprehensive Support: Help systems, training resources, and communities
- Incentive Programs: Recognition for early adopters and champions
Common Measurement Pitfalls
Methodological Errors
Benefit Double-Counting: Avoid counting the same benefits across multiple categories (labor and efficiency, customer and revenue, quality and cost).
Timeline and Scaling Errors: Avoid unrealistic adoption assumptions, linear scaling assumptions, and perfect implementation expectations.
Cost Underestimation: Account for change management, integration complexity, data preparation, and ongoing maintenance costs.
Risk and Uncertainty Management
Inadequate Risk Assessment: Address technology risk, implementation risk, adoption risk, and market risk.
Risk Mitigation Strategies: Sensitivity analysis, Monte Carlo simulation, risk-adjusted discount rates, and comprehensive contingency planning.
Business Size Considerations
Enterprise Implementation (Investment: $ 5- 50 M+)
Characteristics: Comprehensive programs, 18-36 month timelines, 200-500% ROI over 3-5 years, sophisticated risk management.
Success Factors: Portfolio approach, center of excellence, enterprise governance, large-scale change management.
Mid-Market Adoption (Investment: $ 100 K-$5 M)
Characteristics: Focused implementations, 6-18 month timelines, 150-300% ROI over 2-3 years, 12-24 month payback.
Success Factors: Clear ROI focus, limited scope, proven technology, resource optimization.
Small Business Applications (Investment: $ 1 K-$100 K)
Characteristics: No-code/low-code solutions, 1-6 month implementation, 200-500% ROI within 1-2 years.
Success Factors: Self-service platforms, template-based solutions, vendor support, gradual adoption.
ROI Optimization Strategies
Implementation Cost Management
Cost Optimization Framework:
- Technology Costs: Strategic purchasing and usage management
- Implementation Costs: Effective project management
- Operational Costs: Ongoing maintenance and support optimization
- Hidden Costs: Training, change management, productivity transition
Benefit Acceleration Techniques
Value Realization Optimization:
- Quick Win Identification: Early, visible benefits
- Phased Benefit Realization: Incremental benefit delivery
- Adoption Acceleration: Excellent training and support systems
- Scale Economics: Achieving increasing returns with expansion
Risk Mitigation Approaches
Comprehensive Risk Management:
- Technology Risk: Proof of concept validation, diversification, performance monitoring
- Business Risk: Change management, training programs, performance monitoring
- Integration Risk: Comprehensive testing, phased integration, rollback capability
Building Your AI Automation Roadmap
Assessment and Planning Methodology
Current State Assessment
Capability Assessment Dimensions:
- Technology Infrastructure: Architecture, integration capabilities, scalability
- Data Assets: Quality, accessibility, comprehensiveness
- Human Resources: Skills, capabilities, capacity
- Process Maturity: Standardization and optimization
- Change Readiness: Culture and capacity for transformation
Prioritization Framework
Multi-Criteria Decision Analysis:
Priority Score = (Business Impact × 35%) + (Strategic Alignment × 25%) + (Implementation Feasibility × 20%) + (Resource Availability × 10%) + (Risk Assessment × 10%)
Resource Allocation Strategies
Financial Resource Planning
Budget Category Planning:
- Technology Investment: 40-50% (platforms, infrastructure, tools)
- Professional Services: 25-35% (implementation, consulting)
- Internal Resources: 15-25% (team costs, development)
- Training/Change Management: 10-15%
- Contingency: 5-10%
Timeline Development
Multi-Horizon Planning:
- Horizon 1 (0-12 months): Foundation, quick wins, pilot implementations
- Horizon 2 (12-24 months): Scaling, advanced capabilities, integration enhancement
- Horizon 3 (24+ months): Transformation, innovation leadership, ecosystem development
Success Metrics Framework
Comprehensive Measurement
Success Metrics Hierarchy:
- Executive Level: ROI, business impact, competitive position, innovation index
- Operational Level: Process efficiency, cost reduction, quality enhancement, customer satisfaction
- Implementation Level: Project delivery, adoption rates, technical performance, training effectiveness
Implementation Action Framework
Immediate Actions (Next 30 Days)
Executive Alignment: Leadership workshop, resource commitment, team formation, vendor engagement.
Current State Assessment: Technology audit, process documentation, skills assessment, opportunity identification.
Short-Term Initiatives (Next 90 Days)
Strategy Development: Business case development, roadmap creation, vendor selection, pilot planning.
Foundation Building: Governance framework, infrastructure planning, team development, and change management initiation.
Medium-Term Implementation (Next 12 Months)
Pilot Execution: Implementation with monitoring, performance measurement, user training, and optimization.
Scaling Preparation: Scale planning, infrastructure development, capability building, partnership development.
Long-Term Transformation (12+ Months)
Enterprise Deployment: Scale implementation, advanced capabilities, ecosystem development, and continuous innovation.
Strategic Achievement: Competitive advantage, market leadership, full value realization, culture transformation.
Key Success Factors
Critical Elements for Success
Leadership and Governance: Clear vision and strategy, sustained resource commitment, change leadership, effective performance management.
Technical Excellence: User-centric design, agile methodology, integration excellence, performance optimization.
Organizational Capability: Comprehensive stakeholder engagement, excellent communication strategy, training and development programs, and cultural transformation.
Conclusion
AI automation represents a transformative opportunity for organizations to achieve significant business impact across operational efficiency, customer experience, employee productivity, and strategic competitive advantage. Success requires a comprehensive approach that integrates strategic planning, careful implementation, systematic measurement, and continuous optimization.
Key Takeaways:
- Comprehensive Value Creation: AI automation creates value across multiple dimensions beyond simple cost reduction
- Strategic Integration: Successful implementation requires integration with the overall business strategy and organizational transformation
- Systematic Measurement: Sophisticated ROI measurement approaches capture the full spectrum of value creation
- Organizational Transformation: Change management and capability building are essential for realizing full potential
- Continuous Evolution: AI automation is an ongoing journey requiring continuous learning and adaptation
Organizations that master these fundamentals and take a systematic approach to implementation will be well-positioned to achieve substantial returns on their AI automation investments while building sustainable competitive advantages in an increasingly automated business environment.
Comprehensive AI Automation Resources for Every Business Need
This strategic guide specializes in measuring, optimizing, and maximizing return on investment from AI automation initiatives.
Part of our comprehensive resource collection, this guide provides frameworks for value measurement across your organization. From here, you can access our complete library of specialized resources that cover every aspect of AI automation strategy, implementation, and optimization.
Our structured guide series takes you from foundational concepts through advanced implementation strategies, ensuring you have the knowledge and frameworks needed for successful AI automation deployment at any scale.
Each specialized guide builds upon core concepts while diving deep into specific areas of AI automation, providing both strategic insights and practical implementation guidance tailored to your organizational needs and objectives.
Resources and Further Learning
Explore Our AI Automation Content Categories
Continue your exploration with our in-depth coverage of specific topics:
- AI Automation Fundamentals – Core concepts and foundational knowledge
- AI Workflow Automation – Process design and implementation strategies
- AI Agents & Assistants – Intelligent agent development and deployment
- Custom AI Solutions – Build vs. buy decisions and custom development
- Business Impact & ROI – Value measurement and business case development
Stay Updated on AI Automation Developments
The field of AI automation evolves rapidly. To stay current with the latest developments:
- Follow our blog for regular analysis of emerging trends and technologies
- Access our resource library for templates, frameworks, and implementation tools
- Join professional communities to connect with other practitioners
- Subscribe to industry publications for ongoing insights and updates
FREQUENTLY ASKED QUESTIONS
Most organizations see AI automation ROI between 150-500% over 2-5 years, depending on implementation scope and business size.
Small businesses often achieve 200-500% ROI within 1-2 years with focused implementations, while enterprises typically see 200-500% ROI over 3-5 years with comprehensive programs.
Quick wins can deliver measurable benefits within 3-6 months, but full value realization usually takes 12-24 months as systems learn and adoption increases.
Modern AI automation ROI calculation uses a comprehensive framework that includes direct financial benefits (cost reduction, revenue enhancement), operational improvements (efficiency gains, quality improvements), and strategic value (competitive advantage, innovation capability).
The formula is: Comprehensive ROI = (Financial ROI × 40-60%) + (Operational ROI × 25-35%) + (Strategic ROI × 15-25%).
This captures the full spectrum of value creation, including indirect benefits like improved customer satisfaction, employee productivity, and market positioning.
The most critical success factors include strong leadership commitment and change management (accounting for 40-50% of success), proper technology selection and integration (25-30%), and comprehensive user adoption strategies (20-25%).
Organizations that invest adequately in training, maintain realistic timelines, and focus on user experience typically achieve 2- 3x higher ROI than those that treat AI automation as purely a technology implementation.
High-ROI processes share common characteristics: high volume, rule-based decisions, significant manual effort, and clear success metrics.
Top performers include customer service (40-70% efficiency gains), document processing (70-90% time reduction), fraud detection (60-80% false positive reduction), and inventory optimization (25-35% improvement).
The key is starting with processes that have quantifiable inputs and outputs, making ROI measurement straightforward.
Budget allocation typically follows this framework:
- Technology investment (40-50%),
- Professional services and implementation (25-35%),
- Internal resources and training (15-25%), and
- Change management (10-15%), with 5-10% contingency.
Small businesses might invest $ 1 K-$100 K with 1-6 month timelines, mid-market companies $ 100 K-$5 M over 6-18 months, and enterprises $ 5 M+ over 18-36 months.
The key is matching investment level to organizational readiness and starting with pilot projects to prove value before scaling.
These ROI frameworks and measurement strategies provide the foundation for making informed AI automation investment decisions and maximizing business value. For detailed implementation guides, industry-specific ROI benchmarks, and advanced optimization techniques, explore our comprehensive AI automation resources and specialized business impact assessments.
About This Guide
This comprehensive guide is maintained by industry experts and researchers who work directly with organizations implementing AI automation solutions. Content is regularly updated to reflect the latest developments in technology, best practices, and industry applications.
Last Updated: June 2025
This guide represents analysis of current AI automation ROI and best practices. Individual results may vary based on organizational context, implementation approach, and specific use cases.
Was this guide helpful?